From strategic noise mapping to an action programme


Strategic noise maps connect information about sources, buildings and residents with acoustic modelling. They show where attention is needed and provide the evidence for choosing, prioritising and planning protective measures.
Portfolio overview drawing on KFB’s strategic noise mapping experience and the process linking maps with action programmes.
The brief
A city or infrastructure manager needs a consistent picture of environmental noise: where it occurs, which sources contribute and how residents are affected. Information is held by different organisations, collected at different times and prepared for different purposes. Bringing it together is the starting point for a useful assessment.
KFB’s mapping experience includes work for Warsaw, Wrocław, Zielona Góra and Opole, as well as Poland’s General Directorate for National Roads and Motorways. Work across successive mapping cycles provides the context for this overview.
Each commission begins by defining the area, source groups, reference year and intended outputs. This gives the client a shared basis for assessing the situation, communicating findings and informing the next planning stage.
Data and baseline
The model combines terrain, buildings, land use and noise sources. Population and building data support the subsequent assessment of exposure. Their spatial relationships matter: a source, a barrier and a residential façade must occupy the correct positions within the same model.
The information needed varies by source. Road traffic requires data on vehicle flows, categories, speeds and surfaces. Railway assessment uses traffic, rolling stock and track characteristics. Industrial sources require location, emission characteristics and operating periods. Aviation is assessed using the appropriate flight and aircraft information where it falls within the mapping scope.
Data checks establish completeness, consistency and suitability for the reference year. Recording provenance, assumptions and gaps makes the assessment traceable and gives the client a clear basis for future updates.
Assessment and scenarios
Calculations use the methods applicable to the source and mapping cycle, including CNOSSOS-EU for road, railway and industrial noise where required. Polish requirements and relevant GIOŚ guidance inform the work. Measurement data can support model checks when the measured and calculated source conditions are comparable.
Long-term indicators, including Lden and Lnight, describe the annual noise situation. Results show the spatial distribution of noise, areas exceeding applicable limits and estimated exposure of residents and buildings, with source groups assessed separately. Identifying acoustically protected land allows the calculated levels to be interpreted against the relevant planning context and assessment criteria.
Mapping can also include proposed measures and estimates of their effects. Comparing a baseline with a proposed intervention under consistent assumptions helps the client understand which options warrant further development. These comparisons describe calculated outcomes under the stated conditions.
For road noise, one option to assess is a surface designed to reduce tyre–road noise. Its suitability depends on traffic composition and speed, as well as surface condition and maintenance needs. Comparing the existing and proposed surfaces under consistent traffic assumptions helps the client assess this option. Its acoustic performance over time also needs to be considered; resurfacing alone is not a guarantee of a particular reduction.

CONCEPTUAL ILLUSTRATION Road surface selection is one option for addressing tyre–road noise at source. The street view and tyre detail illustrate the subject, not a before-and-after comparison. AI-generated concept; no material specification, project design or acoustic results are shown.
Priorities and programme
The action programme develops the mapping evidence into a planned response. It considers existing measures, planned investments, technical constraints and the practical conditions for delivery. Options should also be assessed for their effects on access, street use and local concerns. Assessment criteria and prioritisation methods must match the requirements applicable to that programme.
The key planning decision is where to act first and why. The programme connects identified problems with proposed tasks, responsible organisations, a timetable and arrangements for monitoring progress. This makes the reasoning behind priorities available to the authorities, infrastructure managers and other participants.
Mapping, programme preparation and formal adoption are separate stages. The technical evidence supports the responsible bodies in selecting and adopting a course of action; delivery then rests with the organisations assigned to the individual tasks.
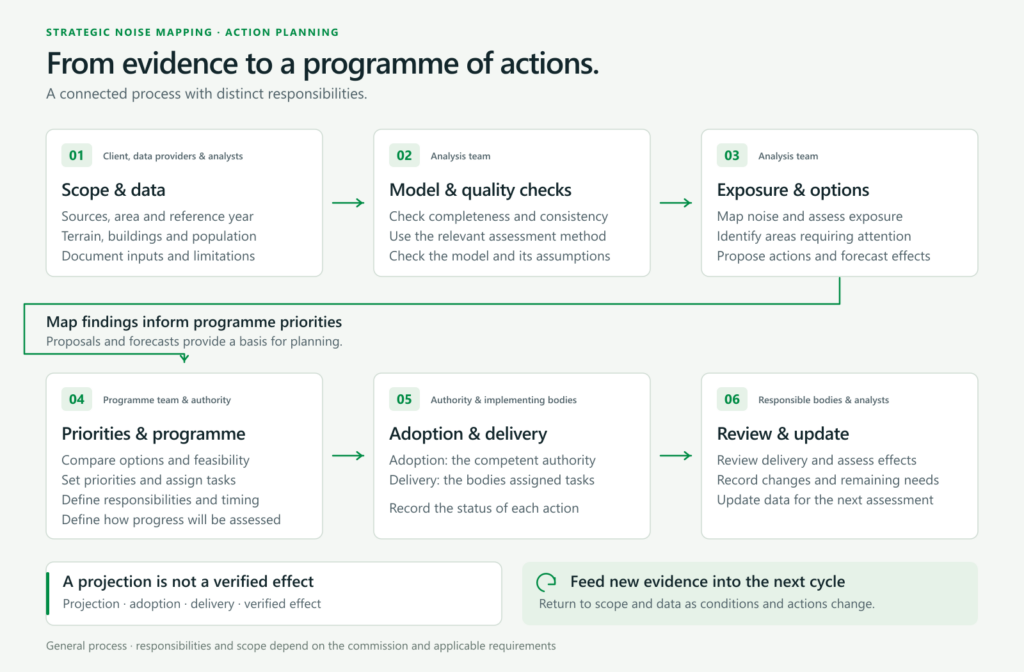
PROCESS DIAGRAM From shared data to assessment, proposals and an action programme. Adoption, implementation and review involve the responsible authorities and delivery bodies; the scope of each mapping commission varies.
The outcome
The immediate result of mapping is a documented assessment: maps, input data and methods, exposure tables, identified problem areas and, within the required scope, proposed measures and projected effects. Consistent spatial data and reporting materials support publication, statutory reporting and further analysis.
For the client, this provides a common reference for explaining the noise situation and preparing an action programme. Clear records distinguish the calculated result, delivery or acceptance of the assessment, adoption of the programme, implementation of measures and subsequent verification. Noise reduction follows from effective measures carried out on the ground and checked after implementation.
Next steps
The value of the work continues through implementation and later mapping cycles. Documented data, model assumptions and limitations help teams update the assessment and understand why results change as infrastructure, traffic or development evolves.
The next stages are to develop and adopt the programme, deliver its tasks and assess progress and effects. Maintaining the connection between evidence, decisions and verification gives each new assessment a useful foundation for the actions that follow.